Revere Health ACO REACH: ACO and MSSP Results from 2012 – 2021
Accountable Care Organization Realizing Equity, Access, and Community Health Model
ACO REACH Name and Location
Revere Health
1055 North 500 West
Provo, Utah 84604
ACO REACH Primary Contact
Debra Taylor
debra.taylor@reverehealth.com
(801) 429-8148
ACO REACH Participants
Revere Health
Composition of ACO REACH:
ACO REACH Professionals Only
No participants are involved in a joint venture between ACO REACH professionals and hospitals
Aggregate Amount of Shared Savings/Losses
- Agreement period beginning 2012, Performance Year 1: -$3,380,810
- Agreement period beginning 2012, Performance Year 2014: -$4,905,245
- Agreement period beginning 2012, Performance Year 2015: $6,429,503
- Agreement period beginning 2012, Performance Year 2016: $3,589,098
- Agreement period beginning 2012, Performance Year 2017: $3,824,346
- Agreement period beginning 2012, Performance Year 2018: $15,311,656.28
- Agreement period beginning 2012, Performance Year 2019: $3,641,606.00
- Agreement period beginning 2012, Performance Year 2020: $9,651,413.58
- Agreement period beginning 2012, Performance Year 2021: $7,284,277
How Savings are Distributed
- Agreement period beginning 2012, Performance Year 2013
- No shared savings to be distributed
- Agreement period beginning 2012, Performance Year 2014
- No shared savings to be distributed
- Agreement period beginning 2012, Performance Year 2015
- Proportion invested in infrastructure: 10%
- Proportion invested in redesigned care processes/resources: 10%
- Proportion of distribution to ACO participants: 80%
- Agreement period beginning 2012, Performance Year 2016
- Proportion invested in infrastructure: 10%
- Proportion invested in redesigned care processes/resources: 10%
- Proportion of distribution to ACO participants: 80%
- Agreement period beginning 2012, Performance Year 2017
- Proportion invested in infrastructure: 10%
- Proportion invested in redesigned care processes/resources: 10%
- Proportion of distribution to ACO participants: 80%
- Agreement period beginning 2012, Performance Year 2018
- Proportion invested in infrastructure: 10%
- Proportion invested in redesigned care processes/resources: 10%
- Proportion of distribution to ACO participants: 80%
- Agreement period beginning 2012, Performance Year 2019
- Proportion invested in infrastructure: 10%
- Proportion invested in redesigned care processes/resources: 10%
- Proportion of distribution to ACO participants: 80%
- Agreement period beginning 2012, Performance Year 2020
- Proportion invested in infrastructure: 10%
- Proportion invested in redesigned care processes/resources: 10%
- Proportion of distribution to ACO participants: 80%
- Agreement period beginning 2012, Performance Year 2021
- Proportion invested in infrastructure: 10%
- Proportion invested in redesigned care processes/resources: 10%
- Proportion of distribution to ACO participants: 80%
Quality Measure Results
2021 Quality Performance Results


2020 Quality Performance Results


2019 Quality Performance Results


2018 Quality Performance Results


2017 Quality Performance Results
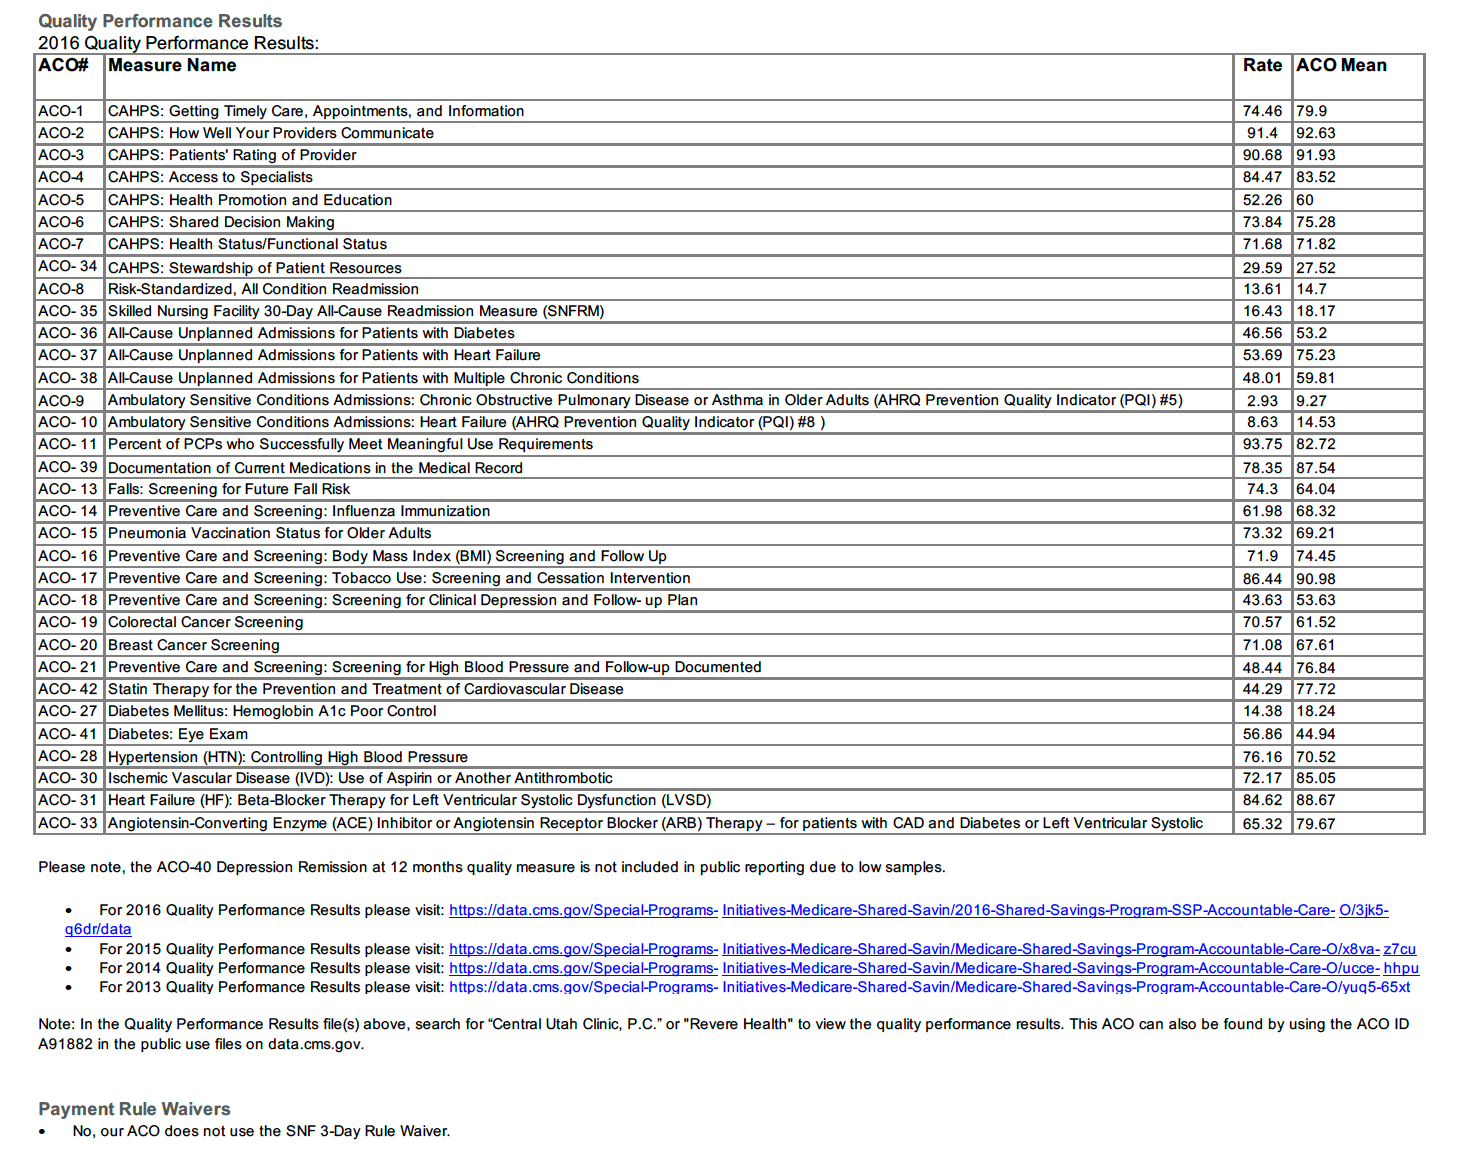
2016 Quality Performance Results
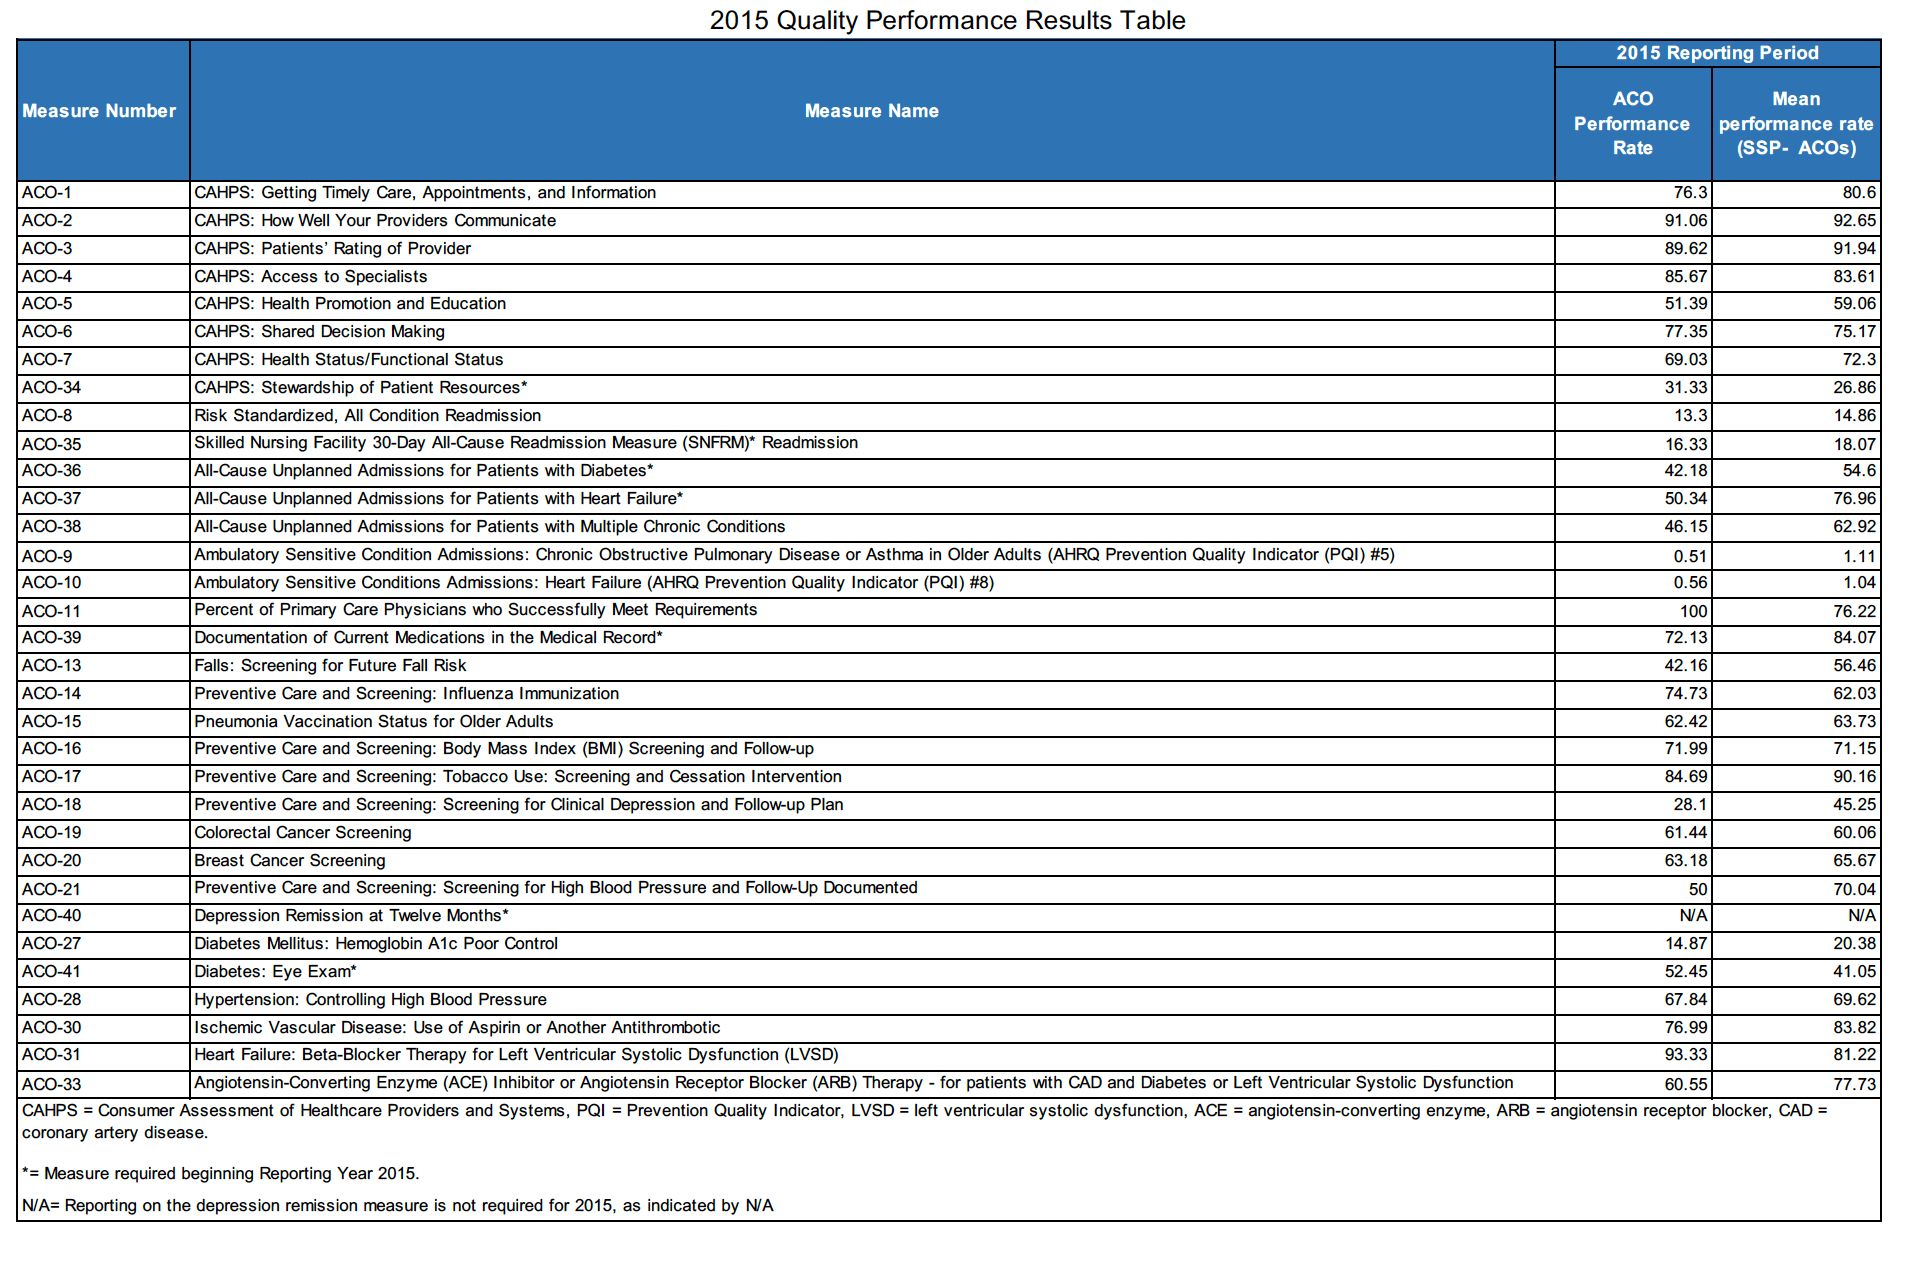
2015 Quality Performance Results
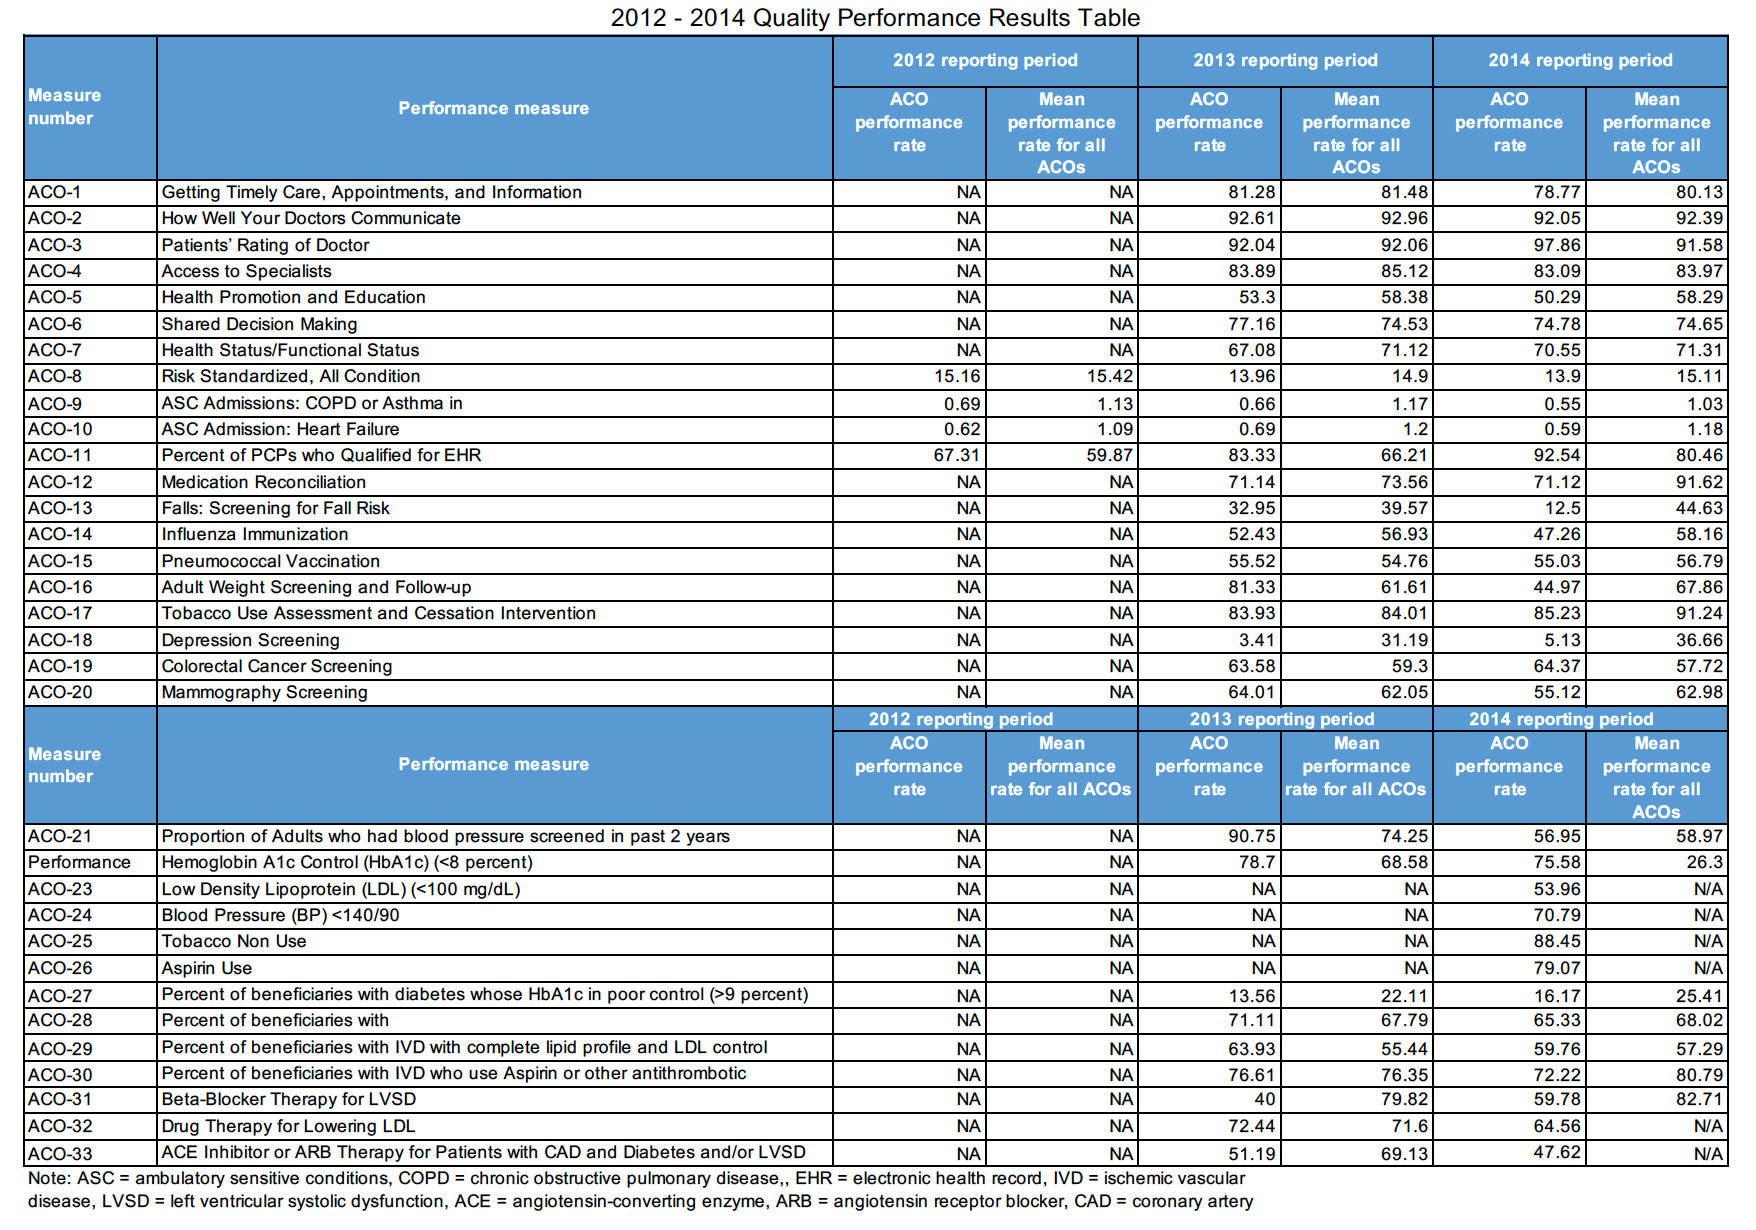
2012 -2014 Quality Performance Results